Better Decisions Through Data.


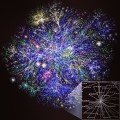
This is an illustration of a streamgraph, a more non-traditional form of multi-dimensional data visualization. A streamgraph is just one of many techniques for converting multi-dimensional data in a single graphic for presentation. This particular example is based on Last.fm music listening habits in January and February 2012.
A version of this article originally appeared as a photo post on our Instagram feed.
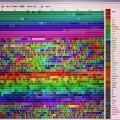


[…] to show more than four dimensions, although your results may vary. Our earlier post showing a streamgraph shows one of these methods, although there are more. Conveying complex information in a meaningful […]
Everything is very open with a very clear explanation of the issues. It was truly informative. Your site is useful. Thank you for sharing!
I enjoy what you guys are up too. This sort of clever work
and exposure! Keep up the good works guys I’ve included
you guys to blogroll.
Cool info on data viz! keep up these posts!
Cool site! This is valuable information on data viz. Thanks so much for sharing.
This is REALLY beautiful but I am surprised that you are not using parallel coordinates (||-coords) to display, visualize and analyze multivariate/multidimensional data.
Thanks
Alfred