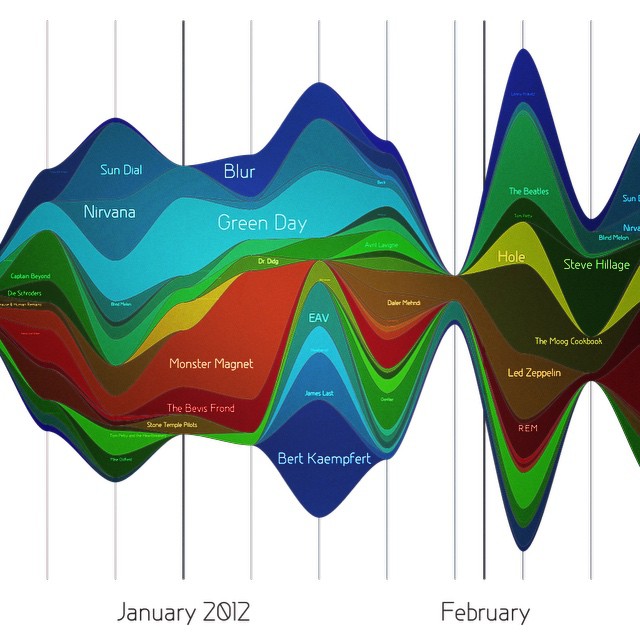
Better Decisions Through Data.


Thanks @pub_pour_tout for the ShoutOut on your InstaaGram Feed
Post and some comments below may be synced from our original Instagram version.
Instagram likes: 87
Better Decisions Through Data.
Thanks @pub_pour_tout for the ShoutOut on your InstaaGram Feed
Post and some comments below may be synced from our original Instagram version.
Instagram likes: 87
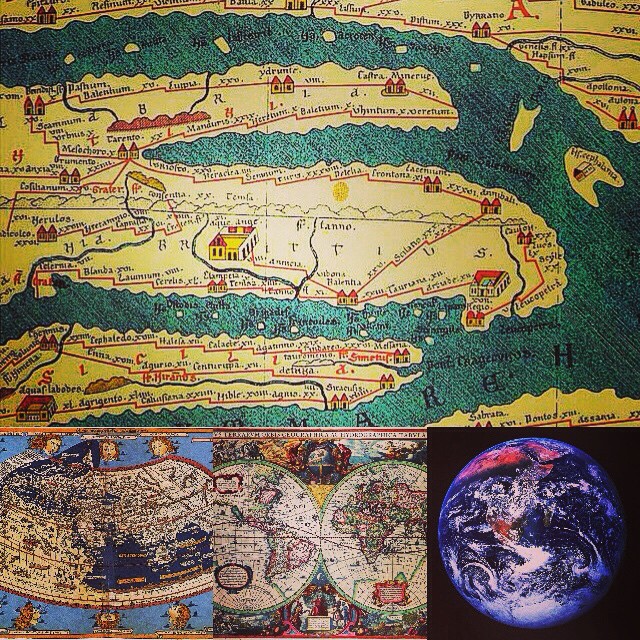
A collage we created to help visualize evolving historical notions of Earth over time. We created it as part of...
Mandelbrot set: fractal math. After spending some time in space, we wanted to come back down to Earth. Continuing on...
Continuing our data visualization series, here is an example of scoreboards as the original analytics dashboards: the Indianapolis Motor Speedway...
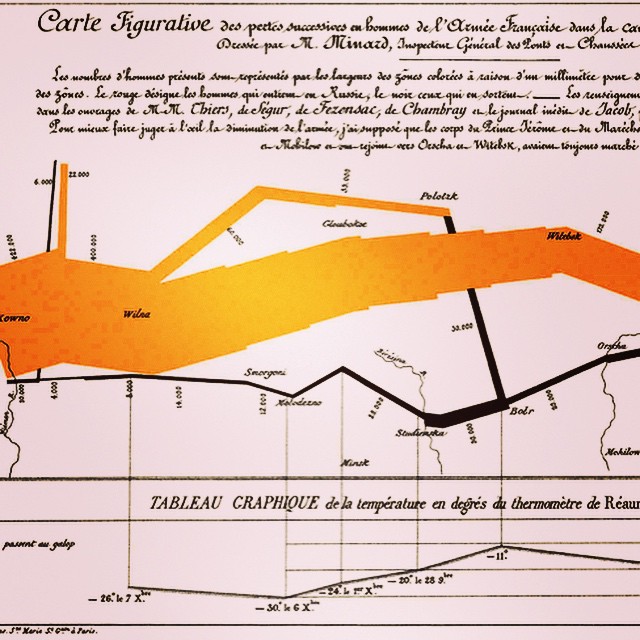
This is an amazing, classic 1869 French infographic and data visualization on Napoleon's disastrous 1812-13 Russia campaign. Although it does...


@travel_ceo Sure … If you’re interested in being featured in our media or getting a shoutout, tell us more about why you’d think we’d love your business on our survey. See our next post, or follow URL in our bio to top of our blog (currently).
Thanks!