Better Decisions Through Data.
Posts Tagged "colorful"
There are 7 results found

Another Voltaire Collage of Glitch Art Variations
Layout collage showing multiple Voltaire glitch art variations. (We’ve previously covered Voltaire & Freedom of Speech.) Not sure what this has to do with The Bieb or the Kardashians (nothing we hope) but we’re amused they came up in yesterday’s reader comments in response to another Voltaire photo post (in the Instagram version of that post). In a few centuries Voltaire will still be remembered; less sure about the Bieb. Sorry beliebers. Post and some comments below may be synced from our original Instagram version. Instagram likes: (more…)… Read the rest
A Visualization of Wikipedia Data
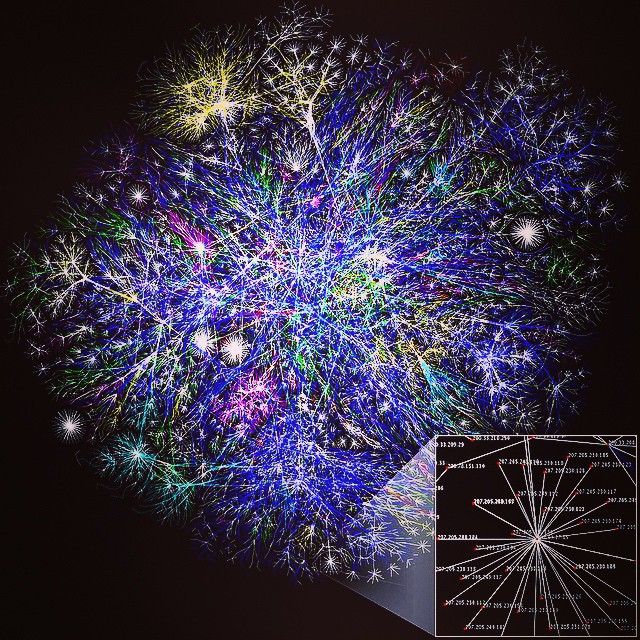
In addition to the difficulty of efficiently storing and processing very large data sets, it is often difficult to come up with compelling visualizations of different database technologies in action. Continuing our recent series on data visualization images on IG, this is a visualization of daily Wikipedia edits activity by the Wikipedia bot script “Pearle” as done by IBM. It’s an excellent example of how to simultaneously visualize both a data process and a large data set. More info can be found in Proceedings of INTERACT (2007). “Visualizing Activity on Wikipedia with Chromograms”. The original data is several terrabytes in size. So this is “big data” in 2015. And it should stay “big data” at least for a while, until the equivalent of Moore’s law for data storage makes it small data in a few decades or so. 🙂 Photo credit: Wikimedia/Fernanda B. Viégas/CC-BY-2.0 Post and some comments below may be synced from our original Instagram version.… Read the rest
Wolfram mathematica: data visualization example
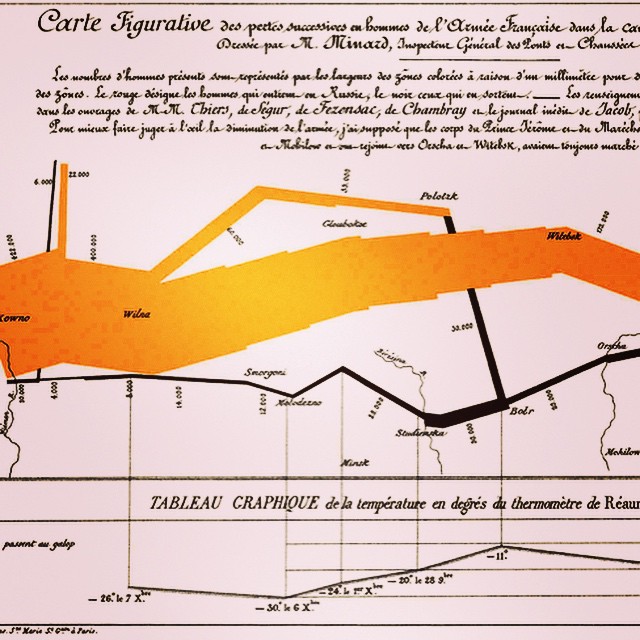
This is example of visualization using Wolfram Mathematica, a commercial software package. We’ve previously discussed some of Wolfram’s other products and ideas in an earlier post on digital physics and cosmology as well as in our posts on IBM Watson. One of the reasons that data visualization remains something of a black art is that there are so many data visualization packages out there. Each package has its strength in a few kinds of plots or types of visualizations. Some of the better packages are commercial (and, unfortunately, not necessarily inexpensive). The high prices mean the experience of any practitioner is likely to be limited to a few commercial visualization packages over the course of a career (since most sites will only license a few packages). Open source data visualization packages are therefore very powerful, since they potentially combine the best of free tools. There are very good free tools out there.… Read the rest