Better Decisions Through Data.


Announcing Government Backdoor Mode for AQcalc
We’re planning to add a new feature to future versions of AQcalc that will allow authorized, legitimate government users to modify the AQcalc readings to make them less strict.
Authorized governmental entities (after a thorough approval process by their internal ethics boards and our corporate lawyers) will be able to modify the standards messages in AQcalc. For a small fee, they will be able to change “Hazardous” to something more informative such as “Señor, air clean now. No pollution. Please stay in our hotel.” Higher fees will apply for shorter modified messages in more convincing, better English that actually fit in the GUI text area. Higher fees may also apply to greater levels of modification (changing “Hazardous” to “Good” or “Excellent” instead of the still alarming “Very Unhealthy”).
A version still being tested will also estimate the socioeconomic status of the user for additional message payload “targeting” options. For an additional fee, authorized, ethical government entities will be able to “target” the degree of message modification based on selected user criteria. (The exact use case for this “Fat Cat messaging mode” is not clear. Loaded vacationers might be targeted to receive greater message modification, since they would presumably have more dough to spend in hotels, and thus convincing them the air was clean would be more profitable. Alternatively, members of the 1% might be more politically influential and less gullible, so they might receive less message modification to avoid scandal. We’ll leave this to our prospective “customer entities” to figure out.)
Assuming successful approval by both their internal ethics boards and our corporate lawyers, interested governments should inform us which dark alley they will be dropping off their suitcases full of cash. (Or better yet, suitcases full of Bitcoin. We understand that Bitcoin cannot be traced and leaves no permanent records, so sounds perfect for this. Also, it has risen seven orders of magnitude, and apparently what goes up just keeps going on up forever. Moreover, there is apparently a limited supply of Bitcoin. California real estate agents were also telling us similar things about real estate a decade ago, and unfortunately we did not invest then.)
Towards International Standards
Obviously, we are not being serious above about government backdoor mode. We take the accurate information provided by our products very seriously.
We think air quality standards should be international, based on the very best science. At present, their are licensing restrictions on the use of some government’s data that requires their standards to be applied. We think the combination of individual sensors and the internet of things, that will go away. You’ll be able to decide which air quality standard you want to apply to your own data, which scientific studies to believe, and what you personal air quality target should be.


[…] We suspect the main practical use of Diffus’ pollution-monitoring clothing is that it garners a lot of press. The photos of fashion models are much more pleasing to readers than a photo of a Dylos sensor or learning about another bad air day in Los Angeles or in New York City suburbs … or Shanghai. […]
[…] Cool! Sounds like a worthy project! And they look better and less comical than some of the air quality masks we’ve previously reviewed! Air quality masks are very much needed in China. […]
[…] Internet of Things applications to improve the air quality and health of citizens (including a light-hearted government backdoor), but we know this is a secondary consideration. If your country is looking to expand at the […]
[…] marketing department. We’ve even poked fun at Facebook’s drones. We’ve posted environmentally-friendly articles as well an article that suggested fracking might be a good idea because … get this, it might […]
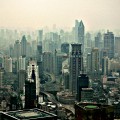
[…] is Shanghai as seen from the bund (We originally used this photo in our much longer article about pollution in China, but the photo itself drew a lot of reader interest here and on social media). The haze over the […]
No idea pollution was this bad in Shanghai. Very interesting. What is being done to cope?