Better Decisions Through Data.
Posts Tagged "ideas"
There are 26 results found

math pattern art: mathematical quilting & design
Mathematical quilting and math pattern art & design: shown here are 17th century Italian quilts made from mathematical patterns. Yesterday’s Hamming metric (or Hamming Error Correcting Code) quilt got us thinking. Turns out there is a branch of quilting making (or perhaps a branch of mathematics if you will), “mathematical quilting.” It looks to math — polynominals, Rule 90 cellular automatons, etc., for inspiration in quilt making and pattern art. Shown here is so called “Florentine work” because these popular quilt designs are based on mathematical patterns originally found on chairs in the Bargello Palace (today an art museum) in Florence Italy. These chairs date to at least the 17th century, if not earlier. There are many types of these quilts, which are typically very colorful. The quilting requires precise counting of squares so that the pattern art design conforms to the mathematical pattern chosen. So yesterday’s crazy quilt, in which math creates art, isn’t unique.… Read the rest
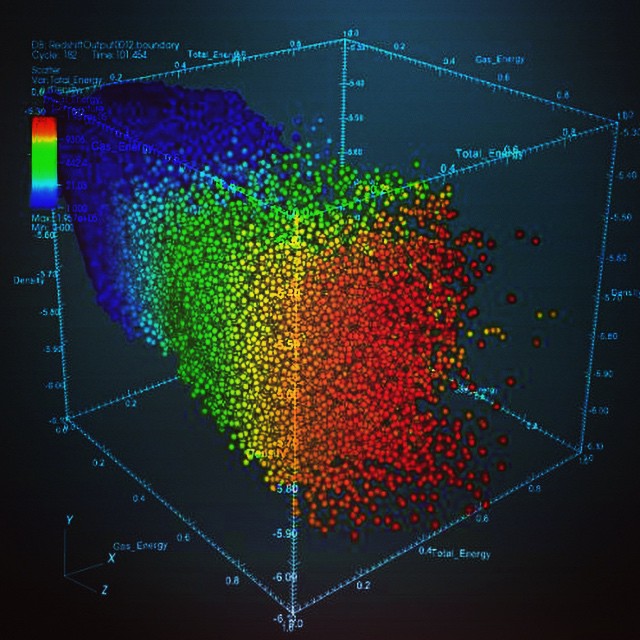
Wolfram mathematica: data visualization example
This is example of visualization using Wolfram Mathematica, a commercial software package. We’ve previously discussed some of Wolfram’s other products and ideas in an earlier post on digital physics and cosmology as well as in our posts on IBM Watson. One of the reasons that data visualization remains something of a black art is that there are so many data visualization packages out there. Each package has its strength in a few kinds of plots or types of visualizations. Some of the better packages are commercial (and, unfortunately, not necessarily inexpensive). The high prices mean the experience of any practitioner is likely to be limited to a few commercial visualization packages over the course of a career (since most sites will only license a few packages). Open source data visualization packages are therefore very powerful, since they potentially combine the best of free tools. There are very good free tools out there.… Read the rest
Kardashev scale: information, energy and civilization
This illustration of a future Dyson Swarm in #space connects many of our past photos to Carl Sagan. 🙂 Suppose we could do one of the endless “I’m just Sagan” meme photos here, but we are trying to be original. 🙂 In our last photo blog post, we talked about information theorist Claude Shannon and the links between data science (or information) and energy gradients (or entropy or thermodynamics). In 1964 Soviet (Russian) astronomer Nikolai Kardashev proposed the Kardashev scale. A Type I civilization could harness terrestrial power equivalent to 1960s Earth, Type II civilization an entire star, and a Type III civilization the energy output of an entire galaxy. Kardashev was expanding on earlier work by Leslie White who attempted to use a similar system to classify ancient human civilizations (thus connecting this photo with our very first photo on the Singularity and math models of ancient human societies). Carl Sagan modified this scale to interpolate between the different values and created a decimal system.… Read the rest