Better Decisions Through Data.
Posts Tagged "photo"
There are 110 results found

BI Inspiration: Lexus supercar automotive dashboard
This is an automotive dashboard on a high-end Lexus supercar. Continuing our look at visuals of (non-business) dashboards (and scoreboards), this is an LCD Tachometer automotive dashboard on the Lexus LFA supercar. (“One of the most expensive Japanese cars ever.” A European TV show suggested status-conscious owners would loudly announce “I’m getting into the expensive Lexus”, making the studied insult this would normally be an oxymoron. Don’t know what the show’s editors drive, but the last we checked your “regular” Lexus was still heavily associated with the 1%. Car & Driver reportedly effused over the supercar, claiming it was a bargain compared to cars like the more expensive Ferrari that it outperformed. Before we get too excited about its state-of-the-art internal combustion engine, as data scientists we’ll state clearly our belief that the future is with alternative propulsion systems like the Tesla’s electric motor. Electric motors have incredible torque and acceleration once the energy storage problems are addressed.)… Read the rest
Data viz: scoreboards as the original analytics dashboard
Continuing our data visualization series, here is an example of scoreboards as the original analytics dashboards: the Indianapolis Motor Speedway Pylon. This is the famous pylon scoreboard at Indianapolis Motor Speedway in Indiana, USA. Business “dashboards”, where executives look at status indicators coming out of analytics (or, in some cases, mathematical models) sound like an automotive analogy. However, scoreboards from sports might be a better analogy than dashboards. This photo encompasses both analogies. (There are plenty of dashboards circling around the track, in addition to scoreboards.) We’ll have more about business dashboards in future postings. Photo credit: Wikimedia. A version of this article originally appeared as a photo post on our Instagram feed. (more…)… Read the rest
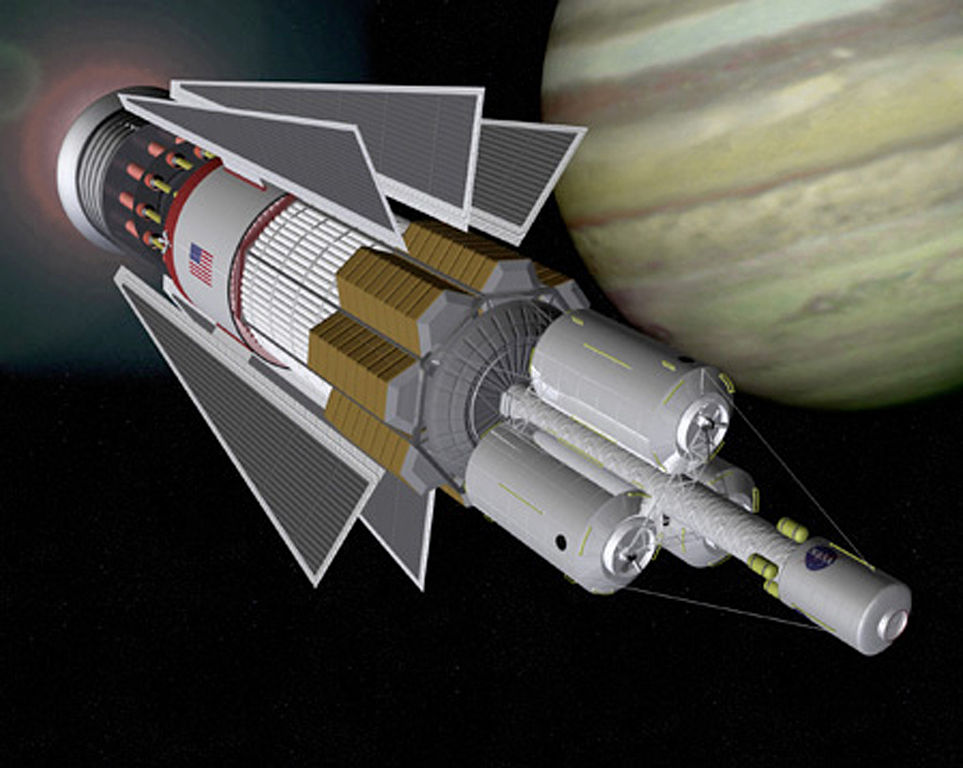
Kardashev scale: information, energy and civilization
This illustration of a future Dyson Swarm in #space connects many of our past photos to Carl Sagan. 🙂 Suppose we could do one of the endless “I’m just Sagan” meme photos here, but we are trying to be original. 🙂 In our last photo blog post, we talked about information theorist Claude Shannon and the links between data science (or information) and energy gradients (or entropy or thermodynamics). In 1964 Soviet (Russian) astronomer Nikolai Kardashev proposed the Kardashev scale. A Type I civilization could harness terrestrial power equivalent to 1960s Earth, Type II civilization an entire star, and a Type III civilization the energy output of an entire galaxy. Kardashev was expanding on earlier work by Leslie White who attempted to use a similar system to classify ancient human civilizations (thus connecting this photo with our very first photo on the Singularity and math models of ancient human societies). Carl Sagan modified this scale to interpolate between the different values and created a decimal system.… Read the rest